CellCapTure
Experience the Ease of Use.
Feel the Unmatched Power.
Acquisition and Analysis
_____________
When it comes to acquisition and analysis, CellCapTure is all you need. With powerful built-in features like templates and auto-compensation tools, acquisition has never been this easy. And in the same flow cytometry software, you can analyze your experiments with post-color compensation, batch analysis, calculation sheets, custom parameters, and overlays.
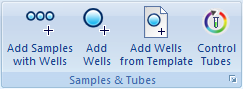
✓ Templates
✓ Append mode
✓ Auto compensation tools
✓ Post-color compensation
✓ Batch analysis
✓ Calculation sheets
✓ Overlays
✓ And much more!
_____________

Automation
_____________
CellCapture’s automation features are more advanced than ever. With CellCapTure’s multi-plate record features and automated shutdown, you can now run experiments day after day. Use heat maps and simple drag-and-drop features to help you with analysis of hundreds or thousands of samples.
✓ Repeated recording of plates
✓ Repeated recording of experiments
✓ Automated shutdown
✓ Heat Map
✓ Patent pending Visual Protocol Designer
_____________
Data Management
_____________
When it comes to your data, this is homebase. With CellCapture’s centralized database, your experiments can be accessed anywhere without cumbersome importing and exporting. Now all the data you’ve acquired is ready to be analyzed—anywhere you are.
✓ Central database on local cytometer PC
✓ Central database on shared server location
✓ Access multiple databases from the same PC
✓ Fully automated database backup and recovery
✓ Compatible with FCS 3.0
_____________
Performance Tracking
_____________
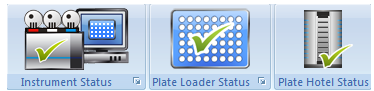
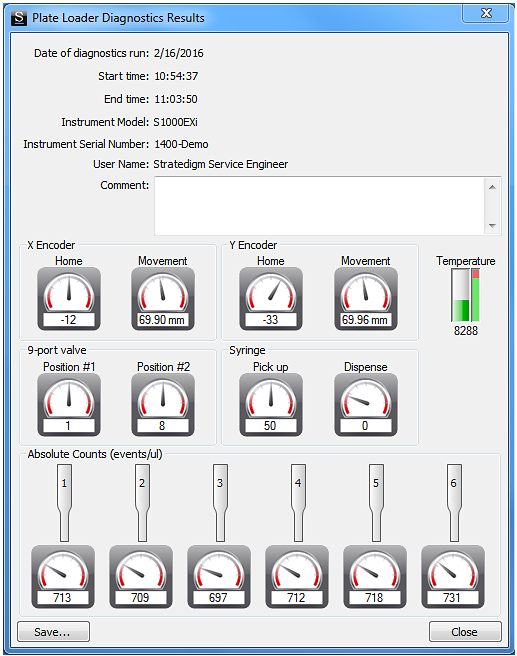
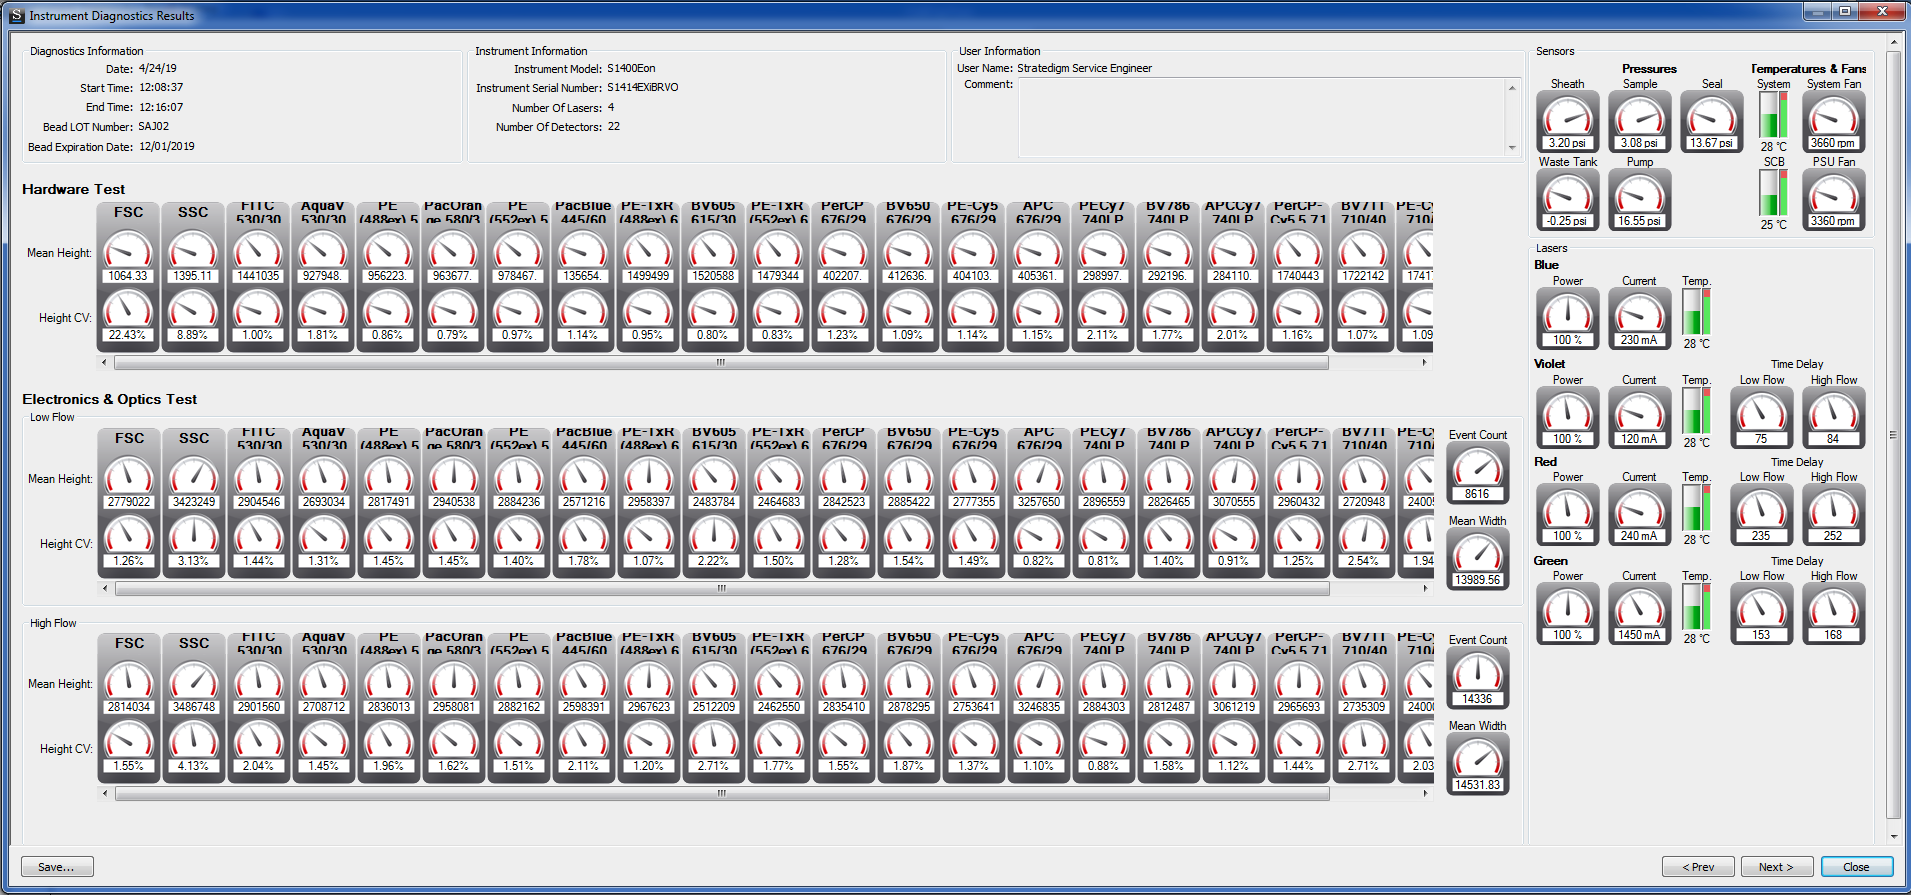
Making sure your instrument is running at optimal conditions at all times is a piece of cake. That’s because our CellCapTure software takes the pulse of your instrument every second. With performance tracking metrics and automated log reporting, instrument downtime is the least of your concerns.
✓ Built-in diagnostics
✓ Automated log reporting
✓ Usage reports
_____________
Request a Software Demo Download the Latest 4.1 Software
CellCapTure 5.0
Download the Latest 5.0 Software
*** Please note that CellCapTure 5.0 only works with the latest S1000EON hardware ***
Latest Features
CellCapTure 5.0 focuses on bringing new and innovative features that streamline your cytometry workflows. Some of these new features include:
✓ “Uber Compensation” – fully automated compensation
✓ “Magic Gating” – automatic population identification and gating
✓ Quick labeling of well names on plates from a spreadsheet or CSV
✓ Pie chart coloring for multiple statistical conditions on a graphical plate view
✓ Simple drag-and-drop plate view to the calculation sheet
✓ Moveable quadrant vertices
✓ Single statistic display on histograms
✓ New split screen modes for better dual-screen support
✓ Easily copy objects to PowerPoint
✓ And many more!

Uber Compensation

Saves
Time
Easy
Setup
Fully
Automated
Minimize
Spillover
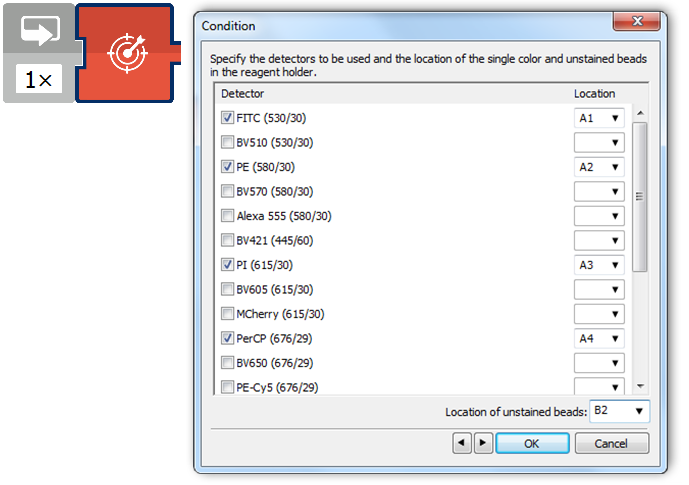
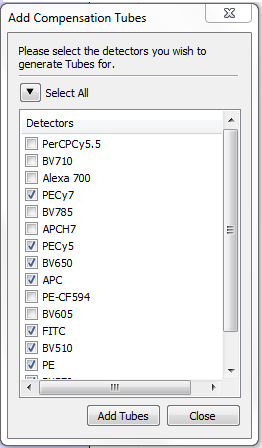
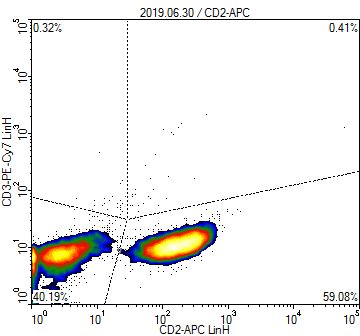
For the first time ever, users have access to fully automated compensation. Stratedigm’s Uber Comp sets up and runs your compensation controls automatically while optimizing detector gains to minimize crosstalk and data spread.
Simply load your single color controls into Eppendorf or cluster tubes onto a Stratedigm A600 HTAS, select the colors to be compensated and click run; CellCapTure does the rest.
Other cytometers require you to:
- Load your samples one-by-one
- Draw your plots
- Draw your gates
- Adjust your voltages first to optimize sensitivity
- Readjust them again if a previous voltage was incorrect causing large spillover values
- Record each single color control
- Then run your samples.
And often times your compensation values result in large data spread because of large amounts of spillover.